15 July 2026
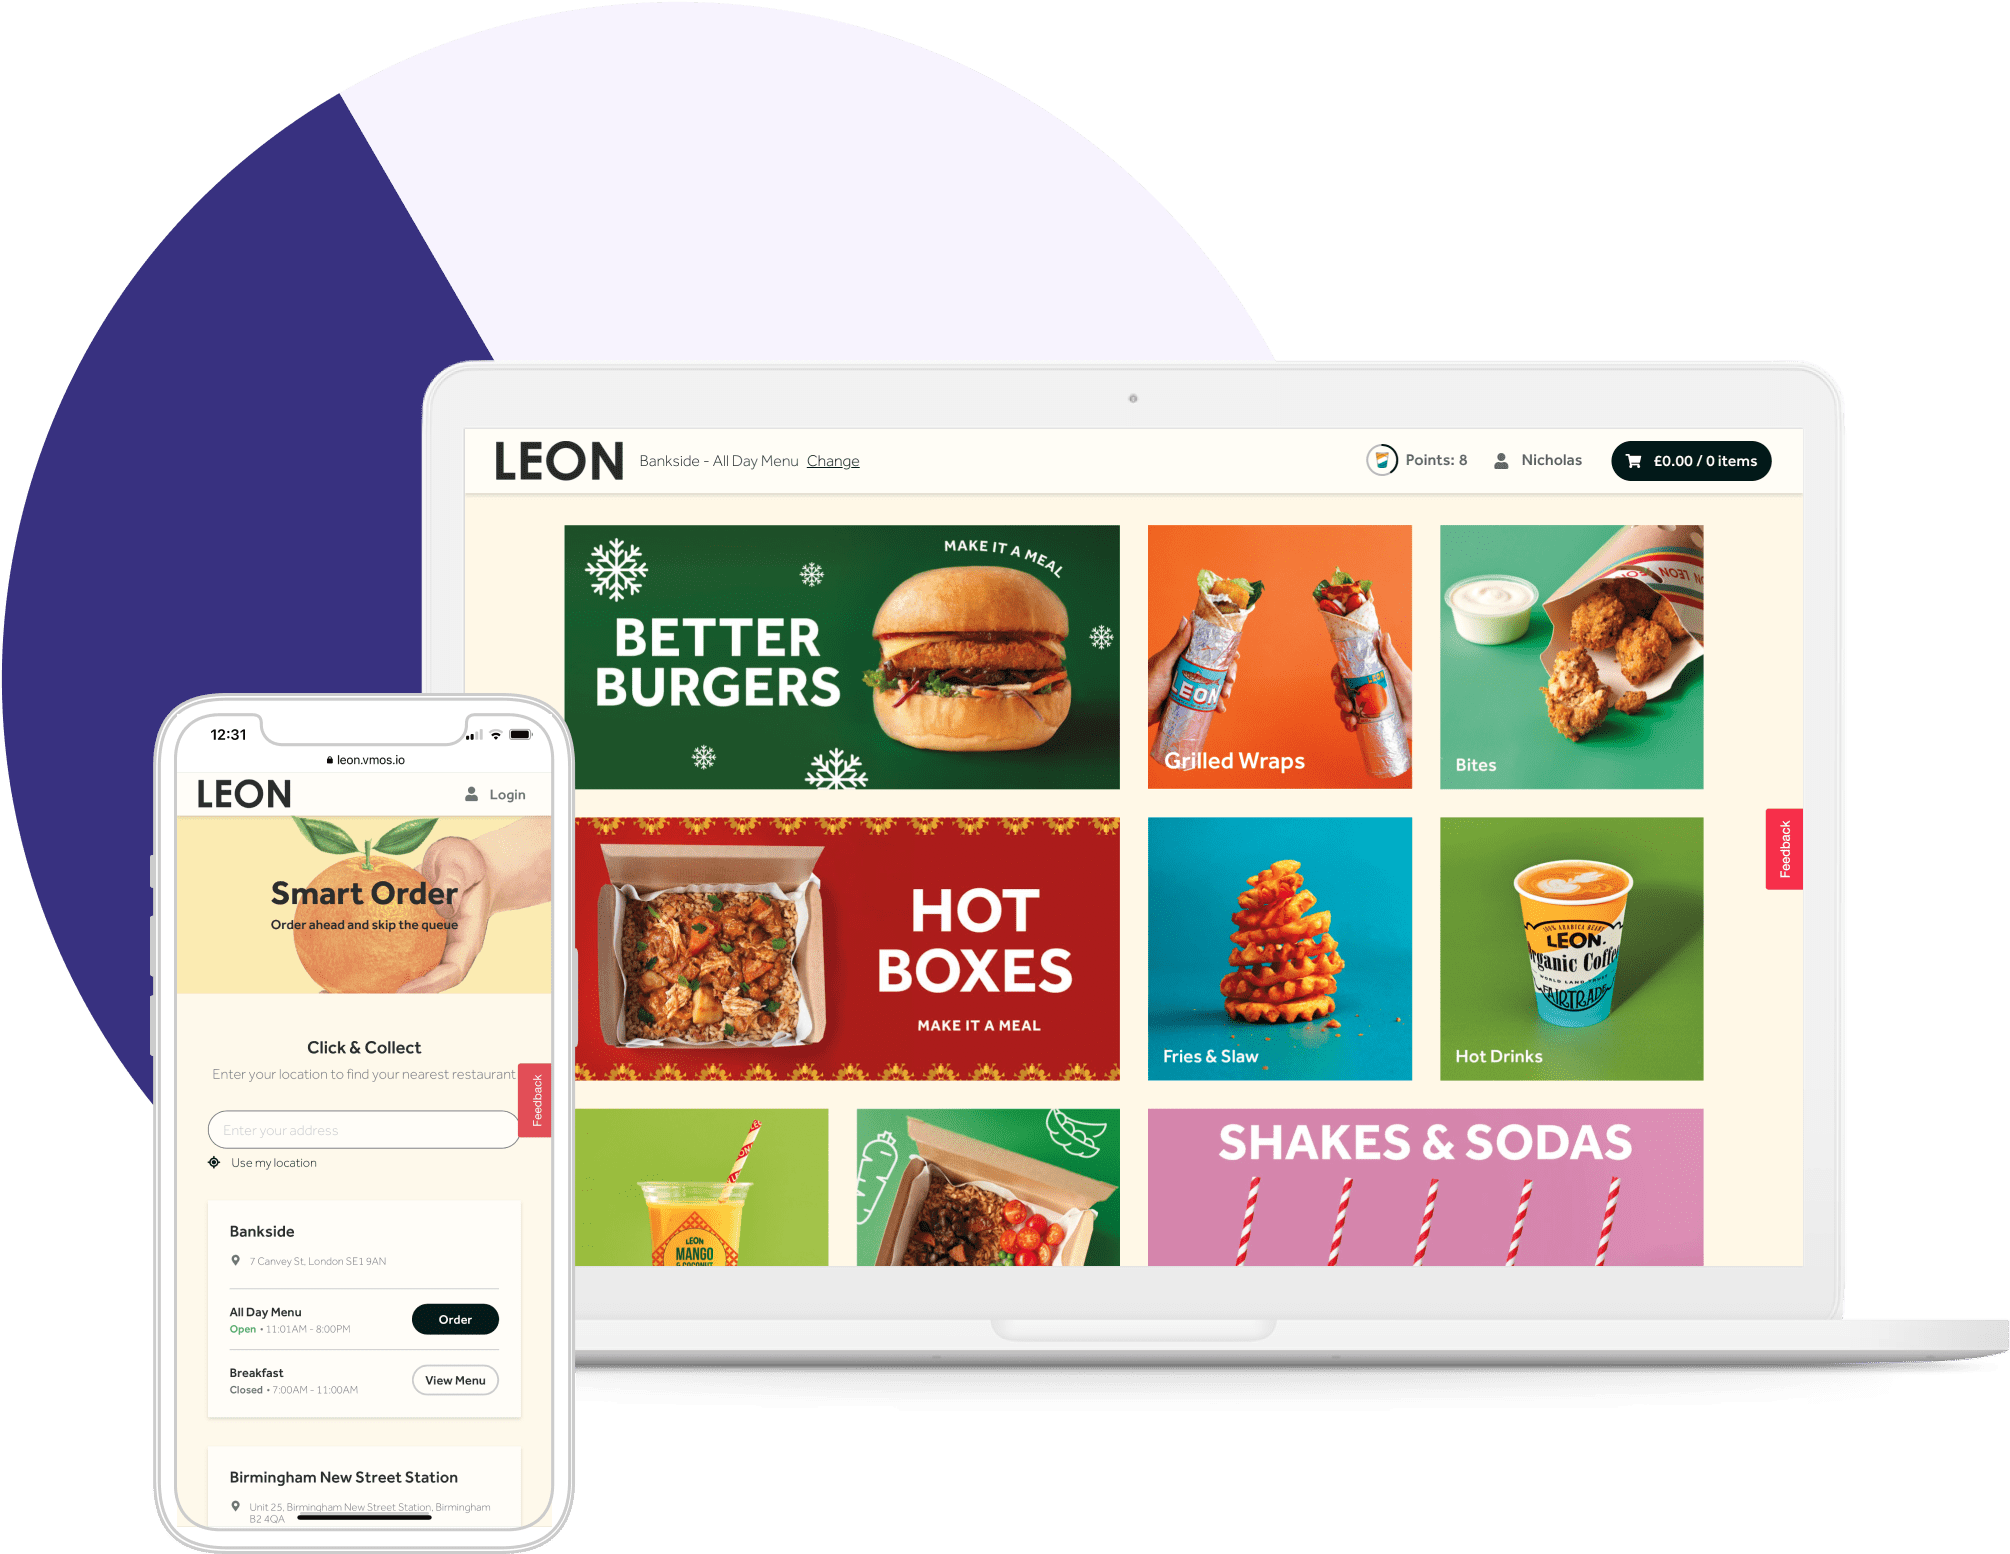
Vita Mojo’s 2026 product roadmap: What we’ve built, what’s next
Chris George, VP of Product, walks through six months of delivered features and gives a first look at the second half of 2026.

It’s hard to overstate the importance of hospitality data in a successful growth strategy for your brand.
Understanding and using the right data is key to driving growth, optimising your operations, and ensuring your customers remain loyal and happy. But with so many data sources available, how can you be sure which numbers really matter?
We thought it was time to demystify data and focus on some essential metrics that should be on your radar.
In the restaurant industry, meals typically account for 66.2% of turnover, but alcoholic drinks – responsible for just 27.2% of turnover – have a much higher profit margin (sometimes up to 85%).
This sales data is like gold dust for understanding customer preferences and peak business times. It’s not just about numbers; it’s about tailoring your operation to what customers love and when they love it.
By analysing this data, you can optimise across the board – whether it’s making sure you’ve got the right amount of staff ready to cover peak periods or promoting the correct options on your menu.
Learn how to analyse your operation’s tech setup – including data analytics – with our Hospitality Technology Buyer’s Guide. Identify exactly where you need to make changes, and how to make an informed and confident decision.

COGS and food cost percentage are critical in menu pricing and inventory management. For example, the sweet spot for food cost percentages is around 28-32% of revenue. Keeping a close watch on COGS and food costs helps ensure your menu isn’t just delicious but also profitable.
For example, if a particular dish has high COGS but low sales, it might be time to reconsider its place on the menu. Similarly, understanding food cost percentage helps in identifying dishes that offer both high customer appeal and profitability.
Sticking with operational efficiency, you can get more specific by keeping an eye on both the average and the outlying amounts customers spend.
For example, a steady increase in average spend could indicate that your upselling strategy is working well, while a decline might signal a need for promotional activities or service enhancements.
If your number of covers is uneven, or you’re struggling to keep up, it could be time to look at staffing levels.
Understanding these numbers helps create a customer experience that satisfies and maximises revenue per visit.
Which dishes make you the most money? It’s important to understand that the most expensive items on your menu may be quite different from the ones with the highest markup.
Focusing on your high-margin items can have a huge effect on your bottom line, with 15% of the menu accounting for more than half of restaurant profits.
It’s not all about stuffing your menu full of high-margin items though. Menu optimisation is about design and presentation. Simple changes such as making sure your colour scheme and choice of fonts is correct, and above all, placing items in the correct place can have a huge effect.
Revenue and profitability metrics, like gross and net profit margins, reveal the effectiveness of your cost management and income generation.
For instance, a low net profit margin might indicate high operational costs, prompting a review of supplier contracts or a taking another look at inventory management. These metrics provide a clear path to efficiency and sustainable business growth
Maintaining a healthy cash flow is vital for the restaurant’s financial well-being.
This metric helps to anticipate and plan for future spending. Regular cash flow analysis can be the difference between comfortably navigating through a slow season and struggling through financial bottlenecks. It’s about keeping the business agile in response to market changes. In fact, successful restaurants often keep a cash reserve for 3-6 months, a smart move to stay afloat when times are lean.
Perhaps surprisingly, many restaurants fail to notice inefficiencies in their stock turnover.
If you have a high turnover rate, then you probably have a well-curated menu and effective stock management in place. If not, then you could be wasting money on items that will sit unsold in your storage area for long periods.
For reference, a good turnover rate for most restaurants is typically between four and eight – meaning that you sell your entire food inventory between four and eight times each month.
If your turnover rate is significantly lower, you could be tying your cash up in stock you can do without. In fact, good inventory management can reduce your food costs by as much as 5%.
Delving into customer behaviour insights can reveal what dishes resonate most with your guests, the frequency of their visits, and their spending habits.
This data is invaluable for tailoring your menu and service to meet customer expectations.
It’s about creating a personalised dining experience that keeps customers coming back. This is especially important when you realise that your most loyal customers can spend up to 67% more than new customers.
Each of these individual metrics and data points form part of the larger puzzle of restaurant success. Understanding and acting upon these insights can lead to profound improvements in efficiency, customer satisfaction, and profitability.
The real challenge is accessing that bigger picture. In order to effectively track all of these numbers, you’ll need information from POS systems, online ordering channels, apps and more.
Analyse one point at a time. As you incorporate more data, you’ll reveal a bigger picture that will provide more value. When you are ready, an integrated analytics platform becomes an invaluable ally.
By turning complex data streams into insights that you can actually act on, a single platform can help you identify trends, recognise what’s working, and make impactful decisions with confidence.
Chris George, VP of Product, walks through six months of delivered features and gives a first look at the second half of 2026.
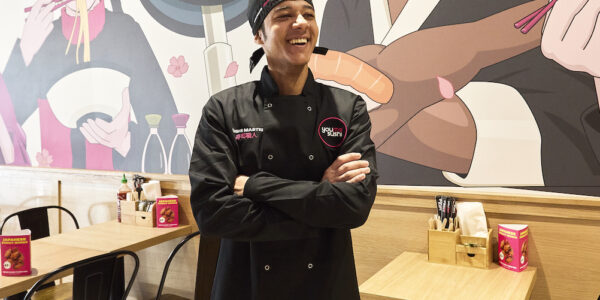
How does a fast-growing QSR brand scale through franchising without losing control? Five lessons from YouMeSushi’s Tim Circus, Head of Franchise.
Keyana Mohammadi, Head of Marketing for Dave’s Hot Chicken UK and Ireland, shared the strategy behind one of the most talked-about quick-service restaurant (QSR) launches in recent UK history.