5 May 2026
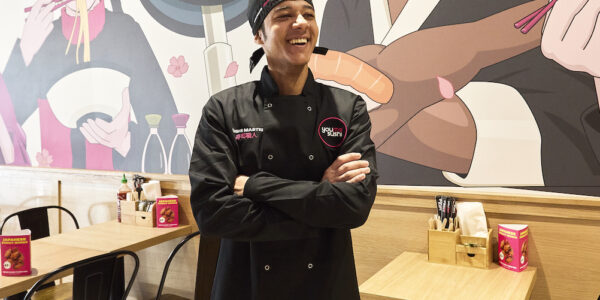
Five lessons from YouMeSushi on building a franchise model that scales
How does a fast-growing QSR brand scale through franchising without losing control? Five lessons from YouMeSushi’s Tim Circus, Head of Franchise.
Learn how to to organise restaurant data, and which data to focus on to help boost revenue for your hospitality brand.
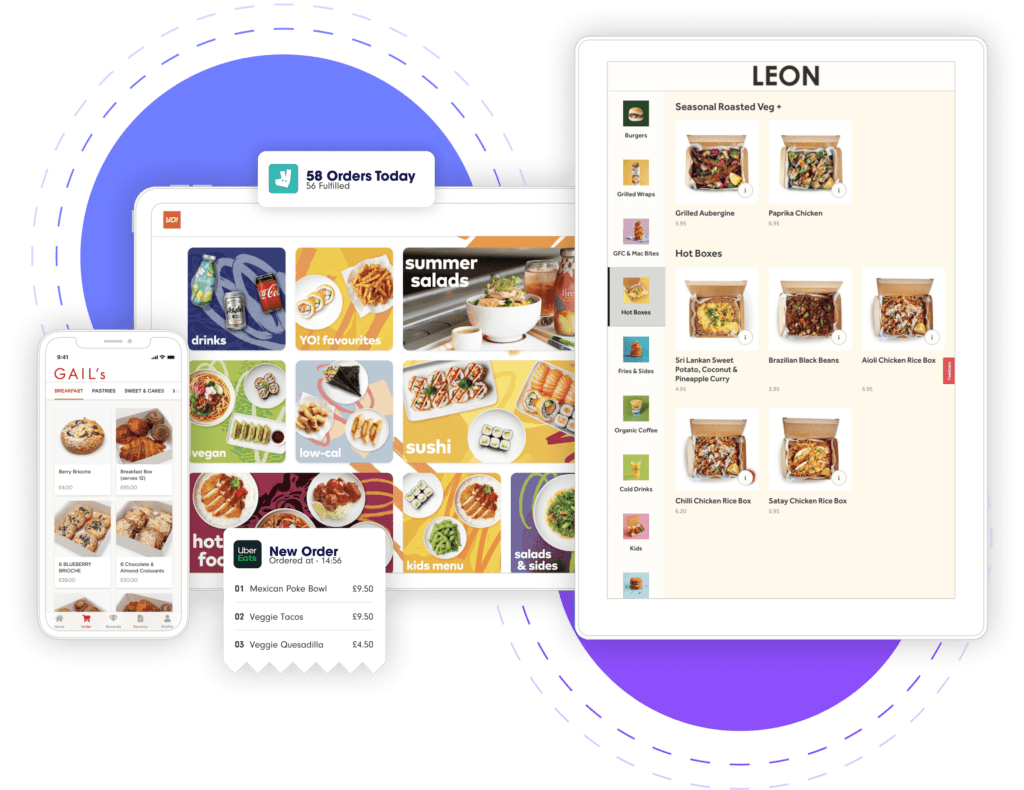
As soon as a guest places an order, you’ll be gathering data on them.
Do they order-in or take away? Are they ordering directly or through third-party delivery platforms? Do they want fries with that?
Every step on the journey is an opportunity to collect data. But once you have it, how can you make sure you’re actually putting it to work in a profitable way?
Let’s take a deeper look at some of the key ways you can organise and use your restaurant data more effectively.
Before you can do anything with it, you need your data organised. This should be easy, but in reality it’s often anything but.
Unlike an Order Management System that will centralise your analytics in one place, data in a fragmented tech stack will be split between multiple channels across your operation. It will require manual work to get this data to a place where it can be leveraged to boost profit.
You’ll need to extract all the data you can from existing systems, and spend some time (or employ someone) organising it clearly.
One of the most important steps you can take is to make sure you use consistent names for all of the data points. If one system lists people by ‘Forename, Surname’, and another calls those ‘First Name, Last Name’, make sure you pick one and stick to it.
You’ll also want to check and remove any duplicates to ensure you haven’t got 15 copies of the same information from different systems.
If this all seems like a pain, take some consolation in knowing that on average, large organisations use as many as 464 different data sources.

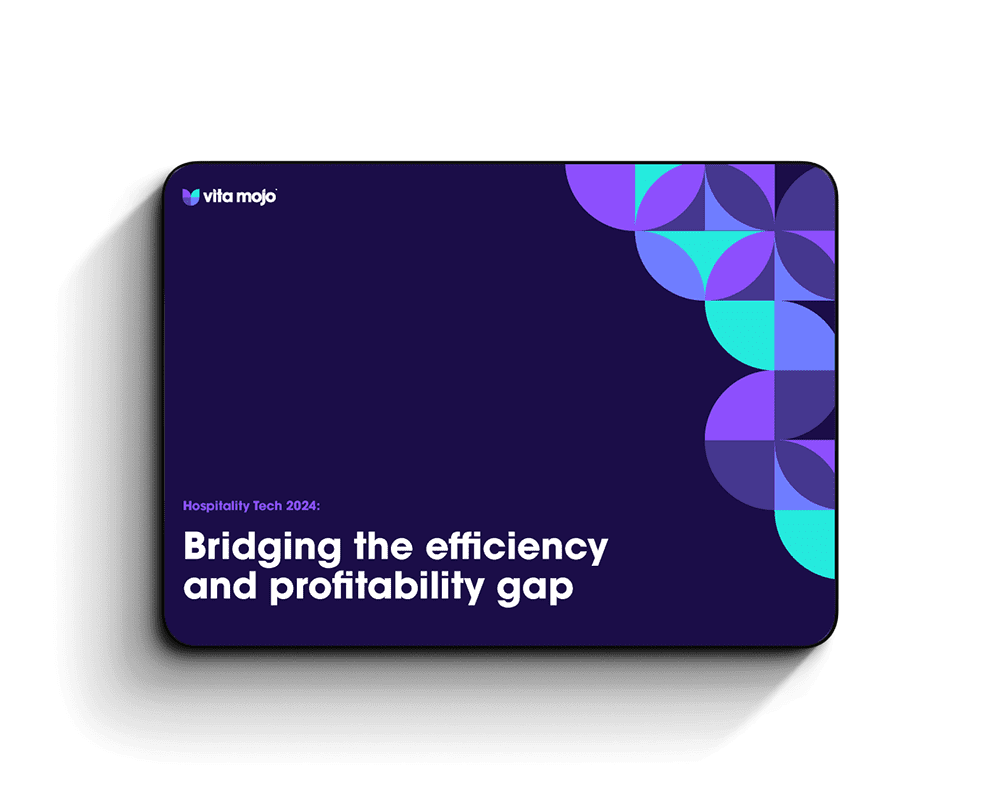
Download our new industry research report ‘Hospitality Tech 2024’ for more data insights straight from operators.
Once you have things organised, you need to know which numbers and data points you should be looking at.
Everything from targeted ads to optimising your weekly specials can be improved by looking closely at the right numbers.
So, how to choose where to focus your efforts for maximum impact?
Start by asking some simple questions:
Questions like these will provide focus for your enquiries, meaning you’ll approach data with clear outcomes in mind.
Perhaps you want to optimise across your entire business. Or perhaps you need to encourage an increase in footfall to a specific outlet on a certain day. The way you use your data will alter depending on the outcome you want.
Let’s consider some common goals, and look at how you can specifically use data to solve these.
Let’s start with managing your inventory. This is a complex task, with the dual challenge of ensuring you have enough stock while minimising wastage. Using data correctly offers you a way out of this predicament.
Data analytics provides a comprehensive view of your inventory levels, past orders, and cash intake.
This data is invaluable in fine-tuning your inventory to cut down on costs and reduce food waste. Having the most requested items in stock at all times is a game-changer.
Additionally, data enables you to predict seasonal trends and plan your stock accordingly.
Preparing in advance for seasonal changes keeps you ahead of competitors and minimises financial losses due to surplus or shortage.
All of this is straightforward, but things become far more interesting – and valuable – when you have more than one location.
Despite aligned menus, there will always be differences in how much of a certain product a single store sells. Let’s say you’re running a midsize chain of burger restaurants. You have two particular locations in mind. Both are successful, but one attracts a significantly higher number of eat-in customers than the other.
Perhaps location A is simply in a more heavily trafficked area, with more natural footfall, while location B is in a more residential location.
Whatever the cause, the effects are many. Eat-in customers may choose significantly different options, or order more two-person meals, while take out could be a mix of single person lunch deals or larger, family-group meals for delivery in the evening. This means the stock required by location A will also be different to location B.
By comparing the data on all of your locations, you can look at your supply routes and cut down on over or under-delivery to specific outlets.
Understanding customer preferences is the key to unlocking the full potential of your menu.
Your menu is not static; it’s a dynamic entity that can evolve to cater to your customers’ tastes and boost sales.
Not all menu items are created equal. By analysing customer data, you can gain deep insights into what dishes are popular and, more importantly, which ones are the most profitable. In a world of data-driven decisions, knowing which menu items perform the best can maximise your sales.
To optimise your menu, use data to identify top-selling dishes and profitable items. Remove or rework the underperforming ones. Incorporate customer feedback and reviews to refine your offerings continually.
By using your data to answer questions, you avoid the risk of making business decisions based on gut feeling or anecdotal evidence. Again, this becomes more important at scale. Regularly looking at the numbers can quickly identify regional preferences and opportunities (if you’ve ever wondered why McDonald’s only serves the Hatch Green Chilli Cheeseburger in New Mexico, it’s as much to do with local ingredient pricing and supply chain optimisation as the local palate).
Of course, there are many more ways you can get help from your data. But the key point to remember here is that the real power lies not in collecting data, but in its ongoing interrogation.
At the start of this post, we discussed manual data organisation.
This can work on a one-off basis, but in order to continuously improve revenue opportunities, existing POS stacks offer scant potential. This is thanks to segmented data sources, multiple points of duplication and limited analytics.
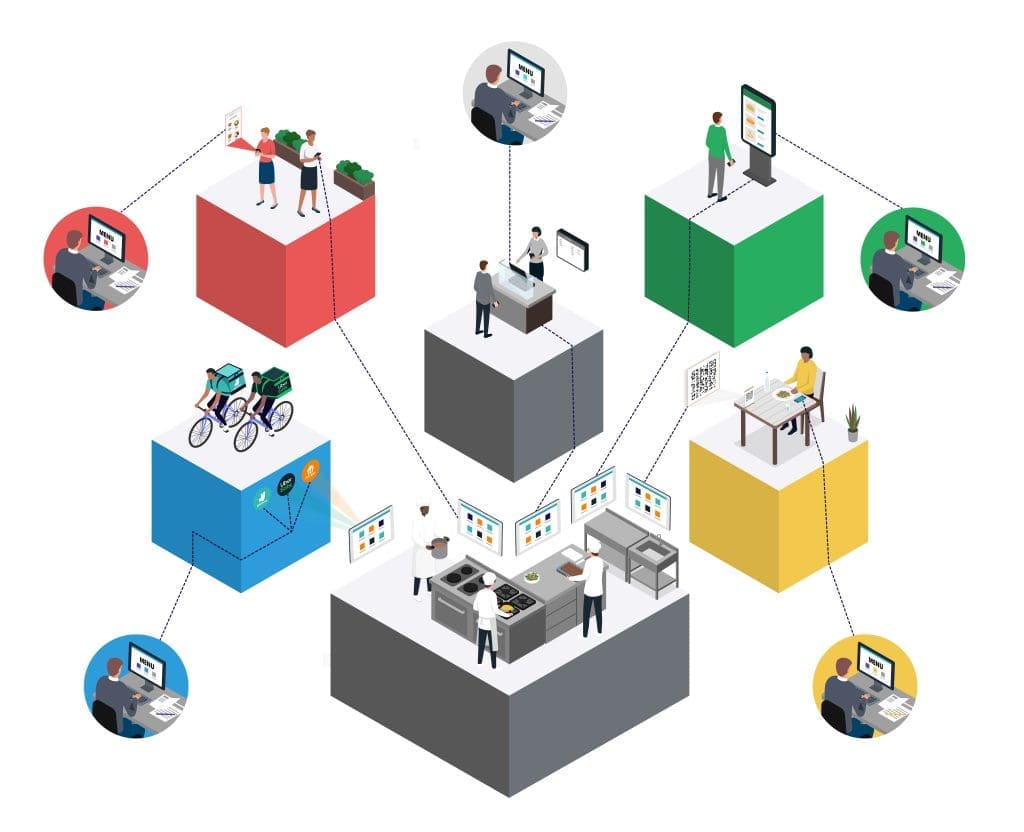
An example of a fragmented tech stack with disconnected data sources
Worse, when you do want to look at your numbers, it’s such a difficult operation that it’s often limited to large-scale changes when absolutely necessary. Your updates and optimisations will be limited to the times when you consciously make a decision to look at these numbers to solve a problem. This means you will always be lagging behind the issues you want to solve.
If you want to get serious about using data though, it’s always worth looking at systems which can combine your data sources.
By using always-on analytics within an order management system, you can factor data into your daily workflow, anticipating issues before they affect your bottom line.
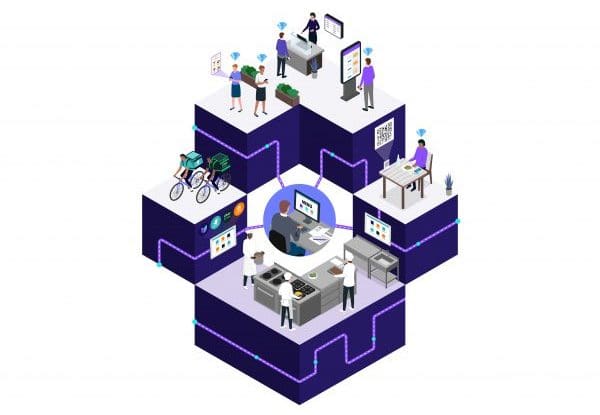
An order management system streamlines data from all your sales channels into one platform
Combining data from multiple sources provides you with an overview of your entire operation, meaning you can solve issues that affect the entire business, while still noting the performance of individual outlets. Taking a broad view means your customer experience benefits too, as you can make the tweaks needed to provide consistently great customer interactions at scale.
Every interaction with a customer provides an opportunity to gather data and put it to work.
How does a fast-growing QSR brand scale through franchising without losing control? Five lessons from YouMeSushi’s Tim Circus, Head of Franchise.
Keyana Mohammadi, Head of Marketing for Dave’s Hot Chicken UK and Ireland, shared the strategy behind one of the most talked-about quick-service restaurant (QSR) launches in recent UK history.

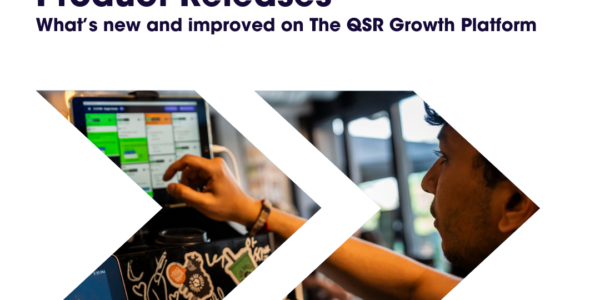
Your regularly updated release notes, revealing what’s available across the Vita Mojo Restaurant Order Management System.